Train Test Split
import pandas as pd
import matplotlib.pyplot as plt
Veri dosyasını indirmek için tıklayınız.
df = pd.read_csv("03a_carprices.csv")
df.head()
| Mileage | Age(yrs) | Sell Price($) | |
|---|---|---|---|
| 0 | 69000 | 6 | 18000 |
| 1 | 35000 | 3 | 34000 |
| 2 | 57000 | 5 | 26100 |
| 3 | 22500 | 2 | 40000 |
| 4 | 46000 | 4 | 31500 |
data=df.to_numpy()
data[:3]
array([[69000,     6, 18000],
       [35000,     3, 34000],
       [57000,     5, 26100]], dtype=int64)
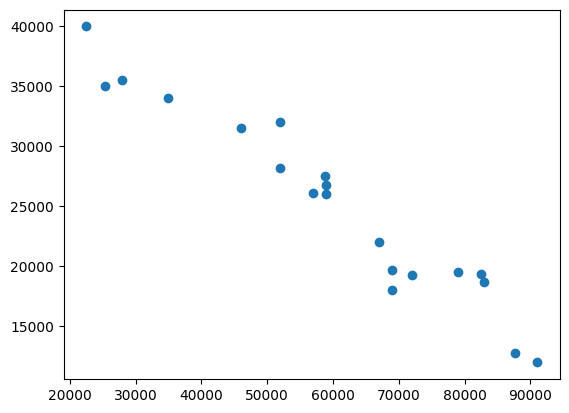
milage=data[:,0]
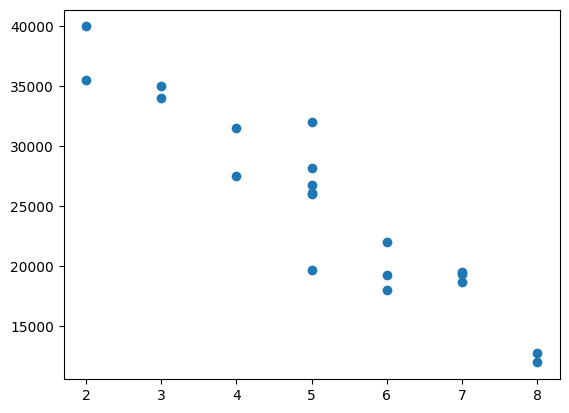
age=data[:,1]
price=data[:,2]
plt.scatter(milage,price)
plt.show()
plt.scatter(age,price)
plt.show()
X = data[:,0:2]
y = data[:,2]
from sklearn.model_selection import train_test_split
X_train, X_test, y_train, y_test = train_test_split(X,y,test_size=0.3)
X_train.shape, y_train.shape
((14, 2), (14,))
X_test.shape, y_test.shape
((6, 2), (6,))
Linear regression
from sklearn.linear_model import LinearRegression
reg = LinearRegression()
reg.fit(X_train, y_train)
X_test
array([[82450,     7],
       [25400,     3],
       [69000,     5],
       [87600,     8],
       [46000,     4],
       [91000,     8]], dtype=int64)
reg.predict(X_test)
array([17224.19150145, 38357.0955021 , 21908.68515977, 15496.47763339,
       30601.10592035, 14169.86679672])
y_test
array([19400, 35000, 19700, 12800, 31500, 12000], dtype=int64)
# R2 score
reg.score(X_test, y_test)
0.9260837288108493
random_state argümanı ile her defasında aynı bölme işlemi sağlanabilir.
X_train, X_test, y_train, y_test = train_test_split(X,y,test_size=0.3,random_state=10)
X_test
array([[72000,     6],
       [83000,     7],
       [59000,     5],
       [52000,     5],
       [22500,     2],
       [87600,     8]], dtype=int64)
Kaynak:
- https://www.youtube.com/watch?v=gmvvaobm7eQ&list=PLeo1K3hjS3uvCeTYTeyfe0-rN5r8zn9rw
- https://github.com/codebasics/py/tree/master/ML