logistic regression
import pandas as pd
from matplotlib import pyplot as plt
Veri dosyasını indirmek için tıklayınız.
df = pd.read_csv("03b_insurance_data.csv")
df.head()
| age | bought_insurance | |
|---|---|---|
| 0 | 22 | 0 |
| 1 | 25 | 0 |
| 2 | 47 | 1 |
| 3 | 52 | 0 |
| 4 | 46 | 1 |
data=df.to_numpy()
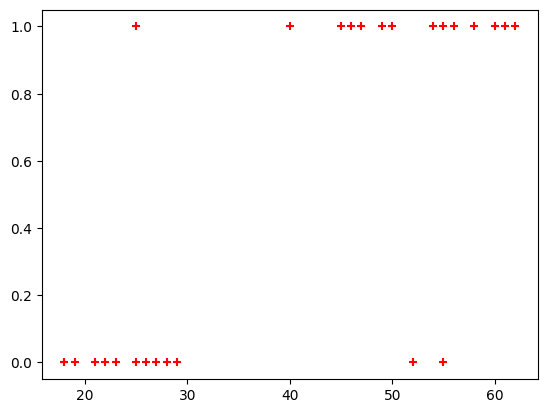
age=data[:,0]
bought=data[:,1]
plt.scatter(age,bought,marker='+',color='red')
plt.show()
from sklearn.model_selection import train_test_split
X_train, X_test, y_train, y_test = train_test_split(age,bought,train_size=0.8)
X_test
array([50, 55, 62, 58, 27, 18], dtype=int64)
age.shape,X_train.shape, X_test.shape
((27,), (21,), (6,))
from sklearn.linear_model import LogisticRegression
model = LogisticRegression()
model.fit(X_train.reshape((-1,1)), y_train)
X_test
array([50, 55, 62, 58, 27, 18], dtype=int64)
y_predicted = model.predict(X_test.reshape((-1,1)))
y_predicted
array([1, 1, 1, 1, 0, 0], dtype=int64)
# 0 ve 1 durumları için olasılıklar.
model.predict_proba(X_test.reshape((-1,1)))
array([[0.10235238, 0.89764762],
       [0.0489281 , 0.9510719 ],
       [0.0166023 , 0.9833977 ],
       [0.0309253 , 0.9690747 ],
       [0.81603332, 0.18396668],
       [0.94893727, 0.05106273]])
model.score(X_test.reshape((-1,1)),y_test)
0.8333333333333334
y_predicted
array([1, 1, 1, 1, 0, 0], dtype=int64)
X_test
array([50, 55, 62, 58, 27, 18], dtype=int64)
theta0=model.intercept_[0]
theta1=model.coef_[0,0]
import math
def sigmoid(x):
    return 1/(1+math.exp(-x))
def h(x, theta0=theta0, theta1=theta1):
    return sigmoid(theta0+ theta1*x)
age=65
h(age)
0.9896360267315567
model.predict([[65]]), model.predict_proba([[65]])
(array([1], dtype=int64), array([[0.01036397, 0.98963603]]))
### Kaynak:
- https://www.youtube.com/watch?v=gmvvaobm7eQ&list=PLeo1K3hjS3uvCeTYTeyfe0-rN5r8zn9rw
- https://github.com/codebasics/py/tree/master/ML