Kümeleme
import pandas as pd
from matplotlib import pyplot as plt
import numpy as np
Veri dosyasını indirmek için tıklayınız.
df = pd.read_csv("03c_income.csv")
df.head()
| Name | Age | Income($) | |
|---|---|---|---|
| 0 | Rob | 27 | 70000 |
| 1 | Michael | 29 | 90000 |
| 2 | Mohan | 29 | 61000 |
| 3 | Ismail | 28 | 60000 |
| 4 | Kory | 42 | 150000 |
data=df.to_numpy()
age=data[:,1].astype(np.int64)
income=data[:,2].astype(np.int64)
data=data[:,1:].astype(np.int64)
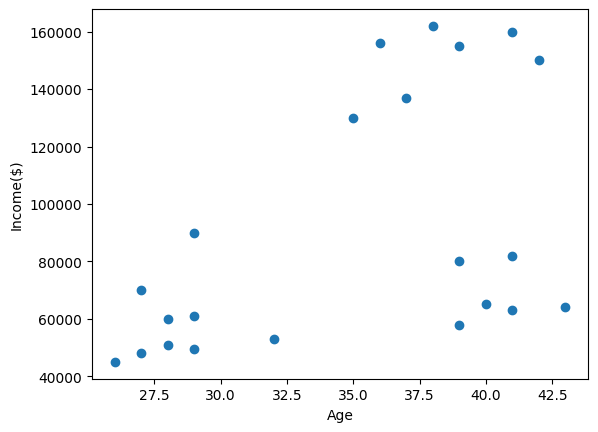
plt.scatter(age,income)
plt.xlabel('Age')
plt.ylabel('Income($)')
plt.show()
from sklearn.cluster import KMeans
km = KMeans(n_clusters=3)
y_predicted = km.fit_predict(data)
y_predicted
C:\anaconda3\envs\lsp\lib\site-packages\sklearn\cluster\_kmeans.py:1416: FutureWarning: The default value of `n_init` will change from 10 to 'auto' in 1.4. Set the value of `n_init` explicitly to suppress the warning
  super()._check_params_vs_input(X, default_n_init=10)
C:\anaconda3\envs\lsp\lib\site-packages\sklearn\cluster\_kmeans.py:1440: UserWarning: KMeans is known to have a memory leak on Windows with MKL, when there are less chunks than available threads. You can avoid it by setting the environment variable OMP_NUM_THREADS=1.
  warnings.warn(


array([0, 0, 2, 2, 1, 1, 1, 1, 1, 1, 1, 2, 2, 2, 2, 2, 2, 2, 2, 0, 0, 2])
age
array([27, 29, 29, 28, 42, 39, 41, 38, 36, 35, 37, 26, 27, 28, 29, 32, 40,
       41, 43, 39, 41, 39], dtype=int64)
income
array([ 70000,  90000,  61000,  60000, 150000, 155000, 160000, 162000,
       156000, 130000, 137000,  45000,  48000,  51000,  49500,  53000,
        65000,  63000,  64000,  80000,  82000,  58000], dtype=int64)
centers=km.cluster_centers_
centers
array([[3.40000000e+01, 8.05000000e+04],
       [3.82857143e+01, 1.50000000e+05],
       [3.29090909e+01, 5.61363636e+04]])
labels = km.labels_
labels
array([0, 0, 2, 2, 1, 1, 1, 1, 1, 1, 1, 2, 2, 2, 2, 2, 2, 2, 2, 0, 0, 2])
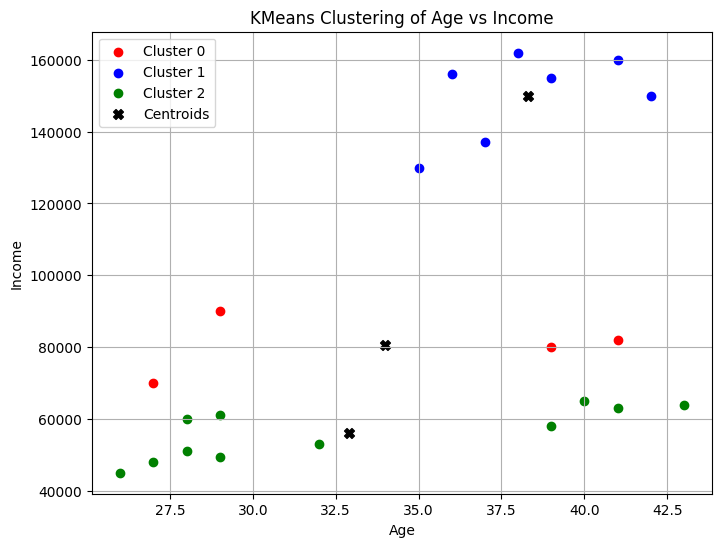
plt.figure(figsize=(8, 6))
colors = ['red', 'blue', 'green']
for i in range(3):
    plt.scatter(data[labels == i, 0], data[labels == i, 1], c=colors[i], label=f'Cluster {i}')

# Küme Merkezlerini Çizdirme
plt.scatter(centers[:, 0], centers[:, 1], c='black', marker='X', s=50, label='Centroids')

plt.xlabel('Age')
plt.ylabel('Income')
plt.title('KMeans Clustering of Age vs Income')
plt.legend()
plt.grid()
plt.show()
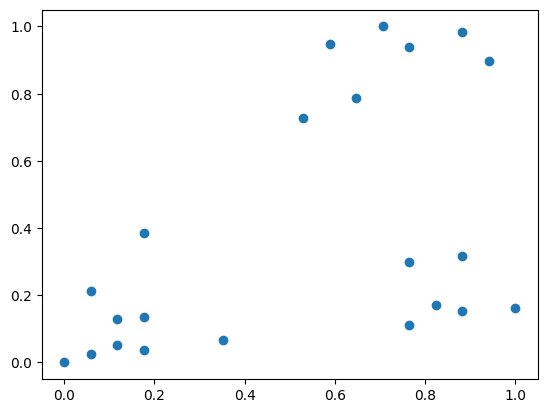
Normalizasyon, verilerin ölçeklendirilmesi
from sklearn.preprocessing import MinMaxScaler
data.shape
(22, 2)
scaler = MinMaxScaler()
# Veriyi ölçekle
data_scaled = scaler.fit_transform(data)
# scaler.inverse_transform(data_scaled)
plt.scatter(data_scaled[:,0],data_scaled[:,1])
plt.show()
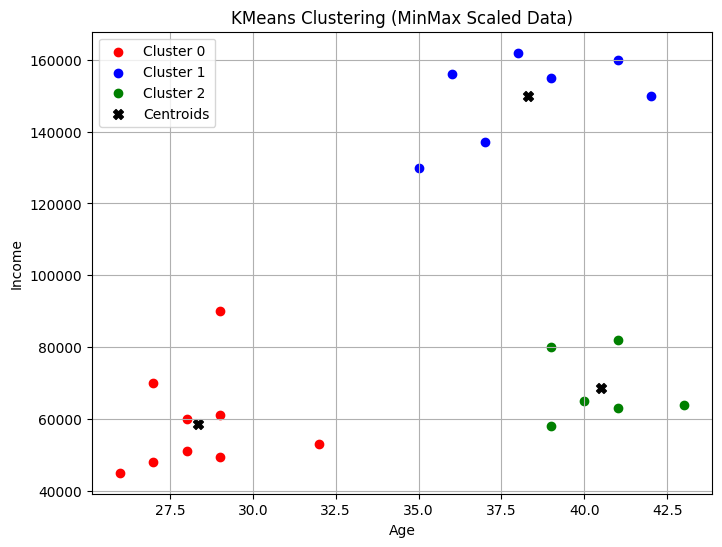
kmeans = KMeans(n_clusters=3)
kmeans.fit(data_scaled)
labels = kmeans.labels_
centers = scaler.inverse_transform(kmeans.cluster_centers_)
plt.figure(figsize=(8, 6))
colors = ['red', 'blue', 'green']
for i in range(3):
    plt.scatter(data[labels == i, 0], data[labels == i, 1], c=colors[i], label=f'Cluster {i}')


plt.scatter(centers[:, 0], centers[:, 1], c='black', marker='X', s=50, label='Centroids')

plt.xlabel('Age')
plt.ylabel('Income')
plt.title('KMeans Clustering (MinMax Scaled Data)')
plt.legend()
plt.grid()
plt.show()
Kaynak:
- https://www.youtube.com/watch?v=gmvvaobm7eQ&list=PLeo1K3hjS3uvCeTYTeyfe0-rN5r8zn9rw
- https://github.com/codebasics/py/tree/master/ML